What data actually matters in badminton?
Badminton is a sport of explosive bursts and fine margins. A useful badminton data analysis setup does not drown you in numbers — it focuses on a handful of metrics that genuinely reflect your game:
- Swing speed trends. One fast smash proves nothing. The trend of your average and top swing speed across weeks shows whether your power and technique are really developing.
- Heart rate zones. Badminton mixes sprint rallies with short recoveries. Knowing how much time you spend in each heart rate zone tells you whether your conditioning matches the demands of a real match.
- Session history. Shot counts and type distribution — smashes, clears, drops, forehand vs backhand — reveal patterns you cannot feel in the moment, like avoiding your backhand under pressure.
- Training frequency. Consistency beats intensity for most amateur players. Tracking sessions per week keeps your plan honest and helps you spot overtraining before it becomes an injury.
A badminton analytics app captures all of this automatically, so you can spend your energy on the court instead of on a spreadsheet.
GoodShot analytics: every number, one app
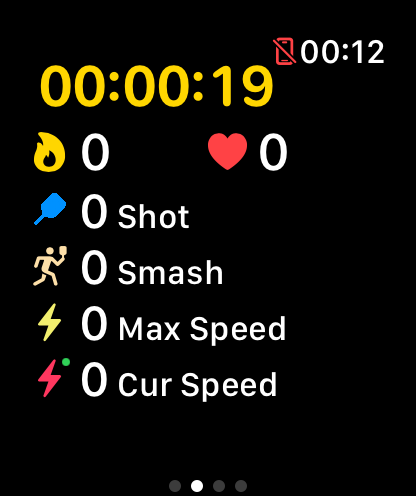
GoodShot records your game on Apple Watch and turns it into clear, actionable badminton statistics on your iPhone.
Trend charts
See swing speed, shot counts and session volume over weeks and months. Spot plateaus early and celebrate real progress with charts that make the trend obvious at a glance.
Heart rate analysis
Zone-by-zone breakdown of every session shows how hard your rallies really are, how fast you recover between points, and how your cardio fitness changes over time.
Apple Health sync
Duration, heart rate and calories from every session are written to Apple Health automatically, so your badminton training counts alongside the rest of your fitness data.
Medals & leaderboards
Earn medals for milestones like fastest smash and longest rally streak, and compare your numbers on leaderboards to stay motivated between sessions.
How to use your data to actually improve
1. Set a baseline
Play two or three normal sessions first and just observe. Note your average smash speed, your typical shot distribution and the heart rate zones you spend the most time in. This baseline is your reference point — every improvement is measured against it, not against someone else's numbers.
2. Track an eight-week block
Pick one or two metrics to move — for example average swing speed and time in the upper heart rate zones — and train with them in mind for eight weeks. Review your trend charts weekly: look for a rising baseline rather than one-off personal bests, and watch training frequency to make sure you are recovering enough. After eight weeks, compare against your baseline and set the next target.
This loop — measure, train, review, adjust — is how a badminton statistics tracker turns casual play into steady, visible progress.
Frequently asked questions
What stats should a badminton player track?
Focus on swing speed trends, shot type distribution, heart rate zones, session history and weekly training frequency. Together they cover both performance and workload, which is what drives improvement.
How does GoodShot collect badminton data?
GoodShot runs on your Apple Watch, using its motion sensors and heart rate monitor. The AI recognizes shot types and measures every swing, then syncs the full analysis to your iPhone automatically.
Does GoodShot sync with Apple Health?
Yes. Workout duration, heart rate and calories are written to Apple Health after every session, alongside your other fitness data.
How long until I see improvement in the data?
Set a baseline from your first few sessions, then track an eight-week block. With regular training, most players see measurable changes in swing speed, consistency and heart rate recovery within that window.
Is the badminton analytics free?
GoodShot is free to download with core tracking and stats included. A PRO membership unlocks advanced analytics, long-term trends and full reports.